Whitepaper - June 2005
By: Terry Mathis, ProAct Safety
Printable Version
What is the best measure of safety performance? Is it the traditional recordable rate, severity rate, cost of accidents, near miss numbers, physical audit scores, behavioral observation percent safe, or perception surveys??? The best answer may be “D. All of the above.”
Companies in America have used the same metrics for years to measure their financial performance. They measure their performance largely through lagging indicators. These metrics are accurate indicators of how the company is performing, but they are not especially useful to help managers make the company perform better. The metrics originated in the early days of the industrial revolution in capitalist countries. The goal was to measure the use of capital and the return on investment. In short, it was accountability metric, not a management metric.
If any of this sounds familiar to safety professionals, it is no coincidence. Safety is also measured by lagging indicators which are ok for accountability but not especially useful for improvement. Recordable and severity rates are an indicator of how successful safety efforts are. Total cost of safety “nonconformance” i.e. the cost of hurting people and reporting to the government, is also a measurement with meaning to financial managers and quality program folks. These metrics can be useful to compare performance to past years or to other firms, but they are not especially indicative of best strategies for improvement.
Near-misses were viewed for many years as a way to more aggressively address risks in the workplace. If employees would recognize these events as potential accidents and take preventive measures, they might avoid more serious and severe outcomes. However, near—miss reporting is not very popular or systematic. Most organizations cannot really trend their near-misses because of reporting irregularities due to time restraints, fear of discipline, and failure to recognize the importance of such reporting.
It can be argued that behavior-based safety (BBS) enjoys a part of its popularity because of the way it is measured. BBS attempts to measure a portion of the safety process that has the potential to predict accidents and suggest prevention strategies, i.e. behaviors. Measuring the frequency and reasons for unsafe acts or behaviors can provide a window to possible future accidents that suggests proactive strategies for accident prevention.
Physical audits or risk assessments can be the counterpart to near-miss or BBS systems. These audits look for conditions that can cause accidents in the workplace. Such audits have been touted by insurance carriers for years and are used by many organizations to good effect. Even if DuPont and the National Safety Council are right in their studies of the ratio of accidents caused by unsafe acts vs. unsafe conditions, the conditions part of safety remains one channel for continued performance in accident reductions. Perception surveys have grown in popularity as safety-improvement tools in recent years. Finding out what workers think can give an insight into the effectiveness of certain safety efforts and why they do or do not work. Aligning the workers with safety goals can be an effective strategy for improvement and perception measurements can indicate to what extent workers agree or disagree. The effectiveness of off-the-shelf perceptions tools has been questioned since they are not specific to sites and cultures and many are used as marketing devices for consulting firms to sell training or consulting products.
While each of these metrics gives some insight into safety performance, none of them is singly sufficient as both a success indicator and a good management tool. However, all of them together built into a balanced scorecard might provide the necessary mix of results measurement and process insight for improvement. If we could connect the leading indicators to the lagging indicators in a meaningful way, we could both predict and measure the impact of our interventions. We could see how our processes impacted the bottom line. How our management impacted the processes. How workers perceptions can be changed and how these impact both processes and results. In short, we might be able to truly see the big picture of safety.
Before we prescribe a formula for measuring the big picture of safety, let’s examine how strategic business managers used the balanced scorecard methodology and see if there is a correlation between strategic management and reducing accidents.
The balanced scorecard was an approach to strategic management developed in late 1990s by Robert Kaplin of the Harvard Business School and David Norton. Realizing the limitations and weaknesses of managing with financial data alone, these two developed a method of measuring other key indicators to provide a clear prescription of what produces the financial results. The idea was to provide a management system (not just a measurement system) to enable organizations to clarify their vision and strategy and translate them into action.
Kaplin and Norton describe the process this way:
The balanced scorecard retains traditional financial measures. But financial measures tell the story of past events, an adequate story for industrial age companies for which investment in long-term capabilities and customer relationships were not critical for success. These financial measures are inadequate, however, for guiding and evaluating the journey that information-age companies must make to create future value through investment in customers, suppliers, employees, processes, technology, and innovation.
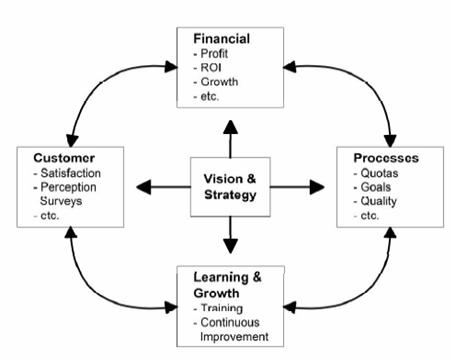
The authors suggested that the organization should be viewed from four perspectives:
The Financial Perspective – traditional measures of financial results are maintained and even expanded. However, use of this data alone unbalances the view of the organization and needs to be viewed in relation to the other categories of information below.
The Customer Perspective – this means customer and customer satisfaction and is often measured through periodic and regular perception surveys and classification of types of customers related to types of products.
The Business Process Perspective – this is a set of metrics to indicate how well critical business processes are working so that their function can be measured against results to see if they are properly aligned. Processes fall into two broad categories: mission-oriented processes and support processes.
The Learning and Growth Perspective – this measures the training and perceptions or attitudes of employees and their ability to learn, adapt, and change as needed to meet organizational goals.
The balanced scorecard methodology builds on some key concepts of previous management ideas such as Total Quality Management (TQM), customer defined quality, Kaizen (continuous improvement), employee teams and other empowerment techniques, feedback, and measurement-based management.
Adapting BSC to Safety
The Results Perspective –
Safety management suffers from many of the same problems that Kaplan and Norton found in strategic management. Safety is unbalanced by its almost exclusive use of accident data. Accident frequency and severity rates are valuable and should not be discarded. But they could benefit from other perspectives as well. Accident data can indicate how well safety management is working; but it does not indicate how to make it work better. Accident data is very much like financial data in these ways. As in the BSC, results data can be enhanced with other data, such as near-miss data and risk assessment data.
Many organizations are also measuring a real financial metric of safety already. The total cost of accidents in terms of workers compensation, hospitalization, and other direct and indirect costs of accidents. Some have borrowed a term from TQM and call this measure the “cost of non-compliance” of safety. This measurement can tend to balance the accident rate when considered as another indicator of safety performance. However, severity is always a variable when accidents are happening and falling into a period of low severity (and resulting low costs) does not always indicate improvement. Also, many organizations do not use this data and rely solely on accident rates. One client site had the lowest total costs of accidents in their entire company, but the VP of Operations was adamant about their need to improve since they were among the highest in their company on total recordable rate.
The People Perspective –
Similar to measuring customer satisfaction in strategic management, safety can measure the people perspective. This metric could include perceptions and attitudes and how they compare among locations and levels in the organization.
How do the people impacted by safety efforts feel about them? How well do people do their part? Many organizations currently administer perception surveys and ask about these and other matters. However, almost no one uses the surveys on a very regular basis or really compares how other safety efforts change employee perceptions. Also, many of the perception instruments are of the off-the-shelf variety more than customized instruments. Perceptions critical to the success of safety efforts can vary from organization to organization. Special programs or initiatives need the support of people and measuring how workers perceive them, management support for them, and other critical factors can be enlightening.
The Learning and Growth Perspective –
This aspect of strategic management has direct application to safety. Even the terminology is a good fit. “To achieve our vision, how will we sustain our ability to change and improve?” Safety needs to measure its culture and the pliability of that culture. Good evaluations of safety training could also be a weighted part of such a metric measuring not only the classroom experience but the transfer of learning to the work place. New employee recruiting and orientation could be evaluated along with new employee safety performance during their critical learning phase of new employment. The ability to find and assimilate new employees into the safety culture is an important element of the company’s ability to adapt to new business realities.
Behavioral metrics similar to Behavior-Based Safety percent safe could be a part of this metric. However, traditions in BBS have mixed the measurement of behavior with announcement, asking permission and coaching interventions that tend to skew the data. A more candid and less intrusive observation might yield a more accurate and insightful metric for the balanced scorecard approach. Several client sites have experimented with such an approach and feel it is a more realistic metric and has helped them to focus the more traditional behavioral observations where they are most needed.
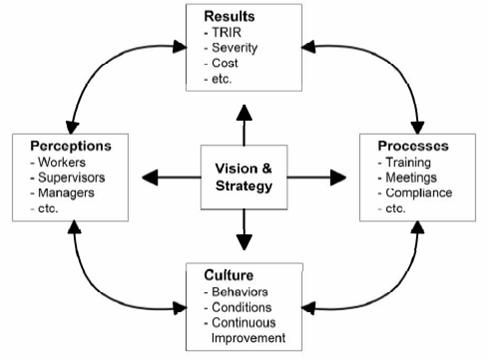
The Process Perspective –
Safety efforts usually include a number of processes aimed at accident reduction: Job Safety Analysis, Conditional Risk Analysis, Accident Investigation, Site Audits, Compliance Enforcement, Communication of Safety Data, just to name a few.
Many organizations have safety training goals and measure the percent of targeted people in classes against the target number. However, training can be measured in at least four ways (see Kirkpatrick). If we knew how the training was rated by those attending, how much information and skills were actually acquired, how much of what was learned transferred to the workplace, and the ROI of training investments, we could add such measures to the balanced scorecard and better identify specific improvement targets.
Many other safety processes could be better measured and the status weighted and reported as a prescriptive part of an overall safety score.
A balanced scorecard approach could give safety managers a regular view of how well these processes are meeting their own goals and how they are contributing to the accomplishment of the overall vision and strategy of safety? A regular analysis of these processes balanced with perceptions of their effectiveness and how their success impacts the safety culture and overall results could provide an insight into opportunities to improve, change, or re-align safety processes.